Essential Google Analytics Website Metrics To Track
Understanding Google Analytics website metrics is essential for improving your website's performance and making informed marketing decisions. These metrics provide valuable insights into visitor behaviour, traffic sources, user engagement, and overall website effectiveness.
By learning how to interpret key Google Analytics website metrics, you can identify opportunities for growth, improve the user experience, and measure the success of your marketing efforts. This guide explores the most important metrics and how to use them to achieve your business goals.
What Are Google Analytics Website Metrics?
Google Analytics website metrics are measurable values used to evaluate and track a website's performance. These analytics provide insights into user behaviour, helping businesses better understand how consumers interact with their websites.
Essential indicators include pageviews (the total number of pages viewed), users, sessions, and bounce rate (the proportion of visitors who depart after reading just one page).
Engagement levels are shown by average session length and pages per session. At the same time, the conversion rate tracks how effectively your site drives specific actions, such as purchases or sign-ups.
Additionally, traffic source metrics identify where visitors come from, such as organic search, social media, or direct visits.
Examining these indicators can help businesses determine their strengths, areas for development and methods for improving user experience and accomplishing their objectives.
Mastering Google Analytics metrics empowers organizations to make data-driven decisions and continuously optimize their online performance.
The 4 Key Google Analytics Website Metrics To Track
Let's break down the key Google Analytics website metrics that will help you better understand your website’s performance and make data-driven decisions.
A. Audience Metrics
Audience metrics can reveal your website's users' locations, demographics, and behavioural patterns. These indicators can help you adjust your marketing tactics and content to better suit your target audience's needs.

1. Users
Definition
Users are unique individuals visiting your website within a timeframe. Good timing, such as peak hours, can increase users, while lousy timing, like late nights, may reduce traffic unless your audience prefers off-hours.
Why It’s Important
Tracking users reveals your audience size and website reach. This metric measures unique visitors, offering insights into traffic volume and user engagement. It helps identify growth trends, evaluate marketing strategies, and plan content effectively.
2. New Users
Definition
New Users are first-time visitors who engage with your site during a specified period. Good timing, such as promotional campaigns during high-traffic hours, boosts new users, while lousy timing, such as off-peak posting, may limit visibility.
Why It’s Important
This metric evaluates your marketing success and website appeal. It measures how well your campaigns attract fresh visitors, helping you refine strategies, improve content targeting, and expand your audience base for sustained growth.
3. Sessions
Definition
A session is a cluster of user interactions on your site within a set timeframe, typically 30 minutes. Good timing, like posting during peak hours, increases sessions, while lousy timing, like holidays, may decrease engagement.
Why It’s Important
Sessions measure user engagement and activity patterns. Tracking sessions using Google Analytics website metrics helps analyze traffic trends, identify content performance, and improve user experience.
4. Session Duration
Definition
Average session duration measures the time users spend on your website per session. Good timing, such as publishing engaging content during peak hours, increases time spent, while lousy timing, such as low-activity periods, may reduce it.
Why It’s Important
Longer durations reflect high user engagement and interest in your content. Short durations may indicate issues such as irrelevant material or poor navigation. Monitoring this helps refine strategies to captivate visitors and meet their needs effectively.
5. Pages Per Session
Definition
The average number of pages a user reads is indicated by the number of pages viewed in a single session. Good numbers, like 3–5 pages, show active exploration, while lousy timing, such as irrelevant updates, may reduce user engagement and page views.
Why It’s Important
Higher pages-per-session ratios signify strong content flow and user interest. It reflects successful navigation design and relevant material.
Lower ratios highlight issues like disengaging content or poor structure, offering opportunities for website improvements.

6. Bounce Rate
Definition
The percentage of visitors that leave after viewing just one page is known as the bounce rate. A reasonable bounce rate is typically low (under 40%), indicating engagement, while an alarming bounce rate is high, often caused by irrelevant content or poor site performance.
Why It’s Important
A high bounce rate suggests visitors are not engaging, possibly due to poor user experience or content mismatch. However, pages like blogs or landing pages naturally have higher bounce rates. Monitoring helps optimize content, navigation, and load times for better user retention.
7. Demographics
Definition
Demographics refer to data about your audience, such as age, gender, location, and interests. This information helps you understand your visitors' makeup, enabling more precise targeting of content and ads based on their profiles.
Why It’s Important
Knowing your audience’s demographics lets you customize content and marketing strategies to meet their preferences better.
Tailored campaigns can appeal to specific age groups or genders, improving engagement and driving conversions by addressing their unique needs and desires.
Wealthy Affiliate – Mini Review
If you’ve ever thought about turning your blog, passion, or niche into an online business,
Wealthy Affiliate (WA) is one of the most beginner-friendly platforms I’ve used.
It combines step-by-step training, website hosting, AI-powered tools,
keyword research, and an active community all in one place.
What I like most is that you can start free (no credit card needed), explore the platform,
test the tools, and connect with other entrepreneurs before upgrading.
WA isn’t a “get rich quick” scheme — success comes from consistent effort
and applying what you learn over time.
B. Acquisition Metrics
Google Analytics acquisition metrics help assess the effectiveness of your marketing channels and identify which sources drive the most valuable visitors.
These indicators are crucial for determining which sources drive the most valuable traffic and evaluating the effectiveness of your marketing channels.
1. Channels
Definition
Channels refer to the various traffic sources that direct visitors to your website, including organic search, paid search, direct traffic, social media, referrals, and email campaigns. Sound sources, such as organic search or a strong social media presence, drive high-quality traffic.
Why It’s Important
Knowing which channels bring the most traffic helps prioritize efforts on the most effective ones. It allows you to optimize marketing strategies and resource allocation, improving overall traffic quality. Focus on high-performing channels to enhance visibility and engagement.
2. Source/Medium
Definition
Source identifies where your website traffic originates, such as Google, Facebook, or referral sites. Medium defines marketing channels like organic search, paid ads, or social media. Knowing both helps you track and optimize your traffic effectively.
Why It’s Important
Tracking source and medium lets you assess the effectiveness of each traffic origin and channel. This data helps you pinpoint successful strategies, adjust campaigns, and allocate resources to the most productive sources and mediums, enhancing overall traffic and engagement.
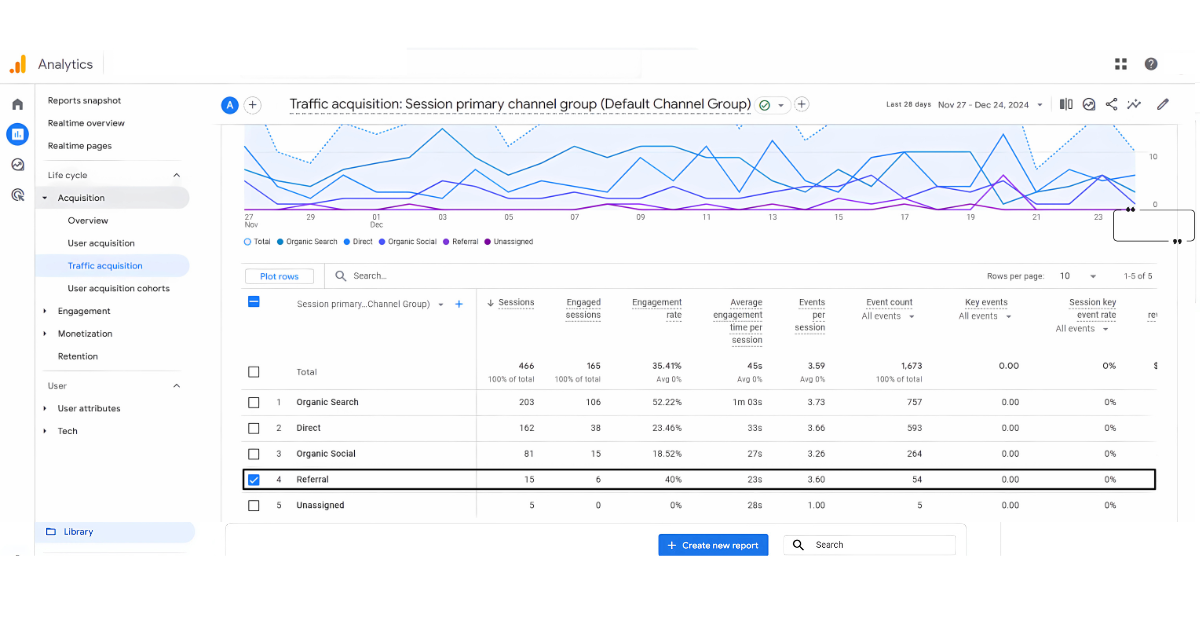
3. Referrals
Definition
The term “referral traffic” describes users who visit your website after clicking links on other websites. These external links direct users to your content, helping increase visibility and potentially bringing in targeted visitors from trusted sources.
Why It’s Important
Monitoring referral traffic helps evaluate the success of partnerships and link-building strategies. It indicates how well others perceive your site and can reveal opportunities to improve site authority, build relationships, and attract more relevant traffic.
4. Organic Search
Definition
People who find your website by clicking on organic search engine results from sites like Google, Bing, or Yahoo are known as organic search traffic. It is driven by effective SEO practices and relevant content appearing in search rankings.
Why It’s Important
Organic search traffic is crucial for sustainable growth, providing a steady stream of visitors without relying on paid ads.
Monitoring this indicator helps evaluate SEO success, pinpoint areas for development, and develop tactics to raise rankings and visibility.
C. Behaviour Metrics
Behaviour metrics provide insights into how users interact with your website once they arrive. These metrics help you understand which pages are most engaging, how users navigate your site, and where they might encounter issues.

1. Pageviews
Definition
Pageviews measure how often a page on your website is viewed. A good pageview count indicates strong interest in specific content, while low pageviews suggest the page is underperforming or not engaging enough.
Why It’s Important
Monitoring page views with Google Analytics identifies popular content and areas for improvement, guiding content strategy.
High views show engaging topics, while low views highlight gaps, enabling refinements that boost user engagement and overall site performance.
2. Top Pages
Definition
This metric identifies the pages with the highest viewership during a specific period. It helps you track which content resonates most with your audience, pinpoint popular pages, and analyze user interest in particular topics.
Why It’s Important
Understanding which pages attract the most visitors allows you to focus on high-performing content. By optimizing these pages and creating similar content, you can enhance user engagement, improve retention, and drive more traffic to your site in the future.
3. Exit Pages
Definition
Exit pages are the final pages visitors see before leaving your website. They can reveal where visitors drop off, providing insight into potential user experience, content, or site navigation issues that need attention.
Why It’s Important
High exit rates on specific pages may signal content issues, poor navigation, or weak calls to action. Analyzing exit pages can help you identify areas for improvement, such as better engagement strategies, more precise navigation, or more compelling content to reduce bounce rates.
4. Site Search
Definition
Site search tracks how frequently users search for specific terms or content on your website. A high number of searches suggests that visitors actively seek information, while a low search volume might indicate that content is easily accessible or lacks interest.
Why It’s Important
Monitoring site search helps identify content gaps or areas where your website may fall short in providing information. By analyzing popular search terms, you can improve content, optimize navigation, and meet user needs, enhancing overall engagement and user satisfaction.
D. Conversion Metrics
Conversion metrics measure how well your website is performing in terms of meeting business goals. Conversions—whether from a purchase, newsletter sign-up, or contact form completion—are the best indicator of success.
1. Goal Completions
Definition
Goal completions keep track of when users finish specific tasks, such as purchasing or completing a contact form. A good number of goal completions indicates your site effectively achieves objectives, while a low number suggests issues with user engagement or conversion barriers.
Why It’s Important
Tracking goal completions using Google Analytics website metrics helps measure how well your website supports business objectives and optimizes user journeys to achieve goals more efficiently.

2. Conversion Rate
Definition
The conversion rate is calculated by dividing the number of visitors by the percentage who complete an objective, such as completing a form or making a transaction. A high conversion rate indicates effective user engagement, while a low rate signals potential friction.
Why It’s Important
A high conversion rate indicates that your website successfully prompts visitors to take action, reflecting a well-designed user experience.
Monitor this metric to identify areas where calls to action, content, and design need improvement to increase conversions.
3. eCommerce Metrics (if applicable)
Revenue
Revenue is the total amount earned from sales on your website. It directly measures your business's financial performance, with higher revenue indicating strong sales. Monitoring revenue helps track growth and the effectiveness of pricing strategies and promotions.
Transactions
Transactions count the number of completed purchases during a specific period. This metric shows the sales volume, helping you understand customer purchasing behaviour. An increase in transactions typically signals effective marketing, improved product offerings, or seasonal demand.
Average Order Value (AOV)
AOV calculates the average amount customers spend per transaction. It helps assess customer spending habits and the success of upselling or cross-selling efforts. A higher AOV indicates that customers purchase more per order, enhancing profitability.
Why It’s Important
These metrics help track an online store's financial health. Businesses can modify pricing, promotions, and strategies to increase sales and revenue by using the trends they uncover in consumer spending, purchase patterns, and the effects of marketing efforts.
4. Event Tracking
Definition
Events in Google Analytics website metrics track user interactions with specific content, providing detailed insights into how users engage with elements beyond page views.
Why It’s Important
Event tracking reveals user actions that help optimize your site. For example, suppose visitors aren't interacting with essential components, such as call-to-action buttons.
In that scenario, you might identify issues and implement data-driven adjustments to enhance user experience and increase conversions.
How To Use Google Analytics For Your Website
You can track user behaviour, learn more about your visitors, and improve your marketing and content by integrating Google Analytics into your website. Here's how to leverage its features to gain insights and improve website performance.
1. Setting Up Google Analytics
If you haven't already done so, create a Google Analytics account. You’ll need a Google account to sign up. Once logged in, click “Start for free” and follow the prompts to set up your website.
Google will provide a unique tracking code (called a Global Site Tag) that you must place on every site page, usually within your HTML section. This allows Google Analytics to track visitor data across your site.
2. Understanding Key Metrics
Once the tracking code is in place, Google Analytics will collect data. Key metrics include:
- Users: The number of distinct visitors to your website.
- Sessions: The overall number of people who visited your website over time.
- Pageviews: How many times users viewed a page.
- Bounce Rate: The percentage of visitors who leave your site after viewing only one page.
These metrics give you a general understanding of your site's performance. By monitoring them, you can identify trends, such as whether users stay on your site long enough to engage with your content or bounce away too quickly.
3. Tracking User Behaviour
Google Analytics provides several tools for examining user engagement with your website. Tools like the Behaviour Flow report and Event Tracking analyze user interactions. They reveal your most visited pages and actions that engage your audience.
Event tracking can show which pages are visited most frequently and where users tend to drop off. Tracking particular actions, such as button clicks or resource downloads, can also provide more specific information about the content your audience is interested in.
4. Setting Up Goals
You may use Google Analytics goals to monitor particular user behaviours, such as form submissions, sales, or newsletter sign-ups, that support your company's goals.
By defining goals, you can monitor your progress and assess how well your website turns visitors into leads or customers. For instance, if you run an e-commerce website, setting a goal for completed transactions can help you track your sales performance.
5. Analyzing Traffic Sources
Google Analytics tracks where your visitors come from, whether from organic search, social media, paid ads, or referral websites.
You drive the most visitors by analyzing acquisition reports. Investing more in the channels that deliver the best results enables you to allocate your marketing efforts more efficiently.
6. Improving SEO And Content Strategy
Google Analytics enhances SEO by tracking landing pages and keywords, revealing what resonates with your audience.
Use this insight to refine your content strategy, focusing on topics that boost organic search traffic. Improved visibility and engagement follow, ensuring your site's performance aligns with audience interests for better results.
7. Real-Time Monitoring
Google Analytics real-time reporting lets you track live site activity, including visitor count, page views, and user locations.
This feature is invaluable for monitoring time-sensitive campaigns or promotions. It provides immediate insights into engagement and performance, enabling you to stay informed and make timely adjustments to optimize audience connection and campaign success.
Conclusion
Mastering Google Analytics website metrics is crucial for understanding user behaviour, optimizing content, and improving marketing strategies.
You can make data-driven decisions that enhance site performance by tracking key metrics like user engagement, traffic sources, and conversion rates.
Consistently monitoring and analyzing this data will help define your website, boost user experience, and drive more traffic and conversions, leading to sustained business growth.
I trust you enjoyed this article on the Essential Google Analytics Website Metrics To Track. Please stay tuned for more insightful blogs on affiliate marketing, online business, and working from anywhere in the world.
Take care!
— JeannetteZ 🌍✨
💬 Your Opinion Is Important To Me
Do you have thoughts, ideas, or questions? I’d love to hear from you. Please leave your comments below or email me directly at Jeannette@WorkFromAnywhereInTheWorld.com.
📚 More Work From Anywhere Reads
🚀 Ready to Build a Business You Can Run from Home
Or from Anywhere in the World?
Imagine creating income on your terms — from home, a cozy café, or wherever life takes you.
With the right tools, training, and community support, it’s entirely possible.
Start your own online business for free — no credit card needed.
Disclosure
This post may contain affiliate links. As an Amazon Associate and participant in other affiliate programs, I earn from qualifying purchases at no extra cost to you. Please read my full affiliate disclosure.