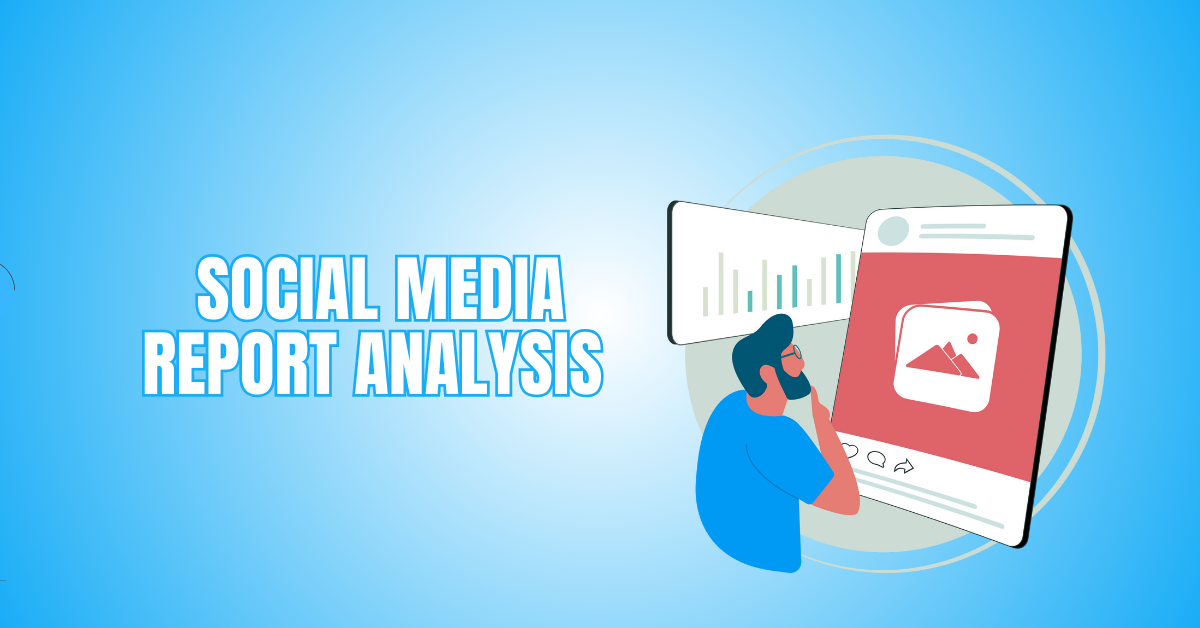
Social Media Report Analysis That Drives Real Results
Understanding your brand’s online presence starts with analyzing social media reports. By breaking down key metrics, trends, and audience behaviour, businesses gain valuable insights to refine their strategies.
This blog dives into how analyzing social media reports can transform raw data into actionable growth. The secret to remaining ahead in the digital world is careful analysis, whether you monitor engagement or campaign performance.
What Is Social Media Report Analysis?
Social media report analysis is the process of reviewing and interpreting data collected from social media platforms to evaluate performance, trends, and audience behaviour.
It involves examining metrics like engagement, reach, impressions, follower growth, and content performance to understand what’s working and needs improvement.
This analysis helps brands and marketers make informed decisions, optimize strategies, and measure the return on investment (ROI) of their social media efforts.
Reports are often generated using analytics tools and presented in dashboards or summaries, offering insights into campaign effectiveness, audience preferences, and competitor activity.
Components Of A Social Media Report
Social media report analysis transforms platform data into actionable insights, helping businesses measure performance, optimize strategies, and achieve marketing goals effectively.
1. Overview / Summary
The overview concisely recaps the social media performance during the reporting period. It highlights key achievements, growth trends, campaign success, and improvement areas.
This section serves as a snapshot for stakeholders to quickly grasp the impact of social media efforts without diving into detailed analytics.
It should summarize total reach, engagement, and audience growth. Using charts or visual highlights enhances clarity and impact. The summary outlines the most important conclusions and establishes the tone for the remainder of the report.
2. Goals & KPIs
This section defines the objectives for social media activities and the key performance indicators used to measure success.
The objectives include raising conversions, website traffic, and brand exposure. Clearly stating these goals ensures all performance data is evaluated against defined targets.
KPIS include engagement rate, follower growth, CTR, and impressions. Showing the progress toward each goal helps measure effectiveness and justify efforts.
Comparisons with previous periods or set benchmarks provide context, assessing what worked and what needs refinement.
3. Audience Insights
Audience insights provide deeper insight into who is interacting with your social media content. This covers demographics including user interests, geography, language, gender, and age.
These insights help determine whether you are reaching the right people and whether your content resonates with them.
The data is usually sourced from built-in platform tools such as Meta Insights or LinkedIn Analytics. Changes in audience segments over time can signal content effectiveness or shifts in reach strategy. Visual representations such as pie charts or infographics help convey this data clearly and effectively.
4. Platform Performance
A detailed social media report analysis highlights platform-specific performance, helping identify where your marketing efforts are most effective and where strategic adjustments are needed.
It includes metrics such as reach, impressions, clicks, and follower growth for platforms such as Facebook, Instagram, LinkedIn, and X.
This separation helps you identify which platforms deliver the best results and which may require more focus or adjustments to strategy.
Comparing platform data side by side over time shows growth trends and informs resource allocation. Visual dashboards or summaries enhance readability and make findings easier to act on.
5. Content Analysis
Content analysis evaluates how well different types of posts perform across platforms. It analyzes engagement, reach, likes, shares, and saves to determine which content appeals most to your audience.
Finding trends in popular formats, publishing schedules, and subjects can help you develop content strategies. Including examples or screenshots of successful posts adds context to the metrics.
This section allows brands to double down on practical formats while refining or dropping less impactful ones. A clear content breakdown ensures your messaging aligns with audience preferences and trends.

6. Engagement Metrics
Engagement metrics reveal how actively users interact with your content and how well your social media strategy fosters community and conversation.
These metrics include likes, comments, shares, saves, retweets, and direct messages. Analyzing these figures helps assess the emotional and practical impact of your posts. High engagement typically indicates relevant, compelling content.
Tracking trends over time can also indicate content fatigue or shifting audience interest. This section should include engagement rate calculations and comparisons to previous periods. Clear visualizations make it easier to identify spikes or dips and tie them back to specific content or events.
7. Traffic & Conversions
This section assesses how well social media drives website traffic and produces conversions, such as leads, sign-ups, or sales.
Tools like Google Analytics and tracked links (e.g., UTM parameters) help identify how users interact after clicking through from social platforms.
Metrics such as click-through rate, bounce rate, time on site, and conversion rate provide insight into how well your content drives action.
Including this data helps connect social efforts to broader business goals. Charts and tables showing referral paths and performance by platform clarify where investment is paying off and where optimization is needed.
8. Competitor Benchmarking
Competitor benchmarking provides context by comparing your social media performance against competitors or industry standards.
It helps assess whether your growth and engagement levels are strong relative to others in your niche. This includes evaluating competitors’ posting frequency, follower growth, engagement metrics, and content strategies.
Tools like Sprout Social, Social Blade, or manual audits can provide this data. Sharing insights through comparative charts or graphs helps visualize your market position.
Benchmarking highlights opportunities for differentiation and sets realistic goals based on what’s achievable within your competitive landscape.
9. Recommendations
Based on the social media report analysis, the recommendations provide data-driven strategies to enhance future performance by optimizing content, timing, and platform focus.
These recommendations aim to improve future performance by building on what’s working and addressing underperforming areas.
Suggestions might include changing content types, posting times, investing more in specific platforms, or adjusting targeting strategies.
Each recommendation should be tied to specific data points from the report to justify its importance. Presenting these in a bullet list or summary format makes it easy for teams to digest and implement. This section turns insights into practical steps for future success.

Key Metrics In Social Media Reporting
Not all metrics are created equal. You'll want to focus on specific KPIS depending on your goals—brand awareness, engagement, lead generation, or conversions. Here are the core categories:
1. Likes Or Reactions
Likes or reactions are basic signals that your audience finds your content appealing or agreeable. While they don’t measure deep interaction, they are often the first indication of post success and play a role in algorithmic promotion.
A steady stream of likes can suggest strong visual appeal, message clarity, or brand affinity. However, they should always be viewed in context alongside deeper metrics, such as comments or shares, to assess authentic engagement. Alone, they offer limited insights but remain valuable for quick feedback.
Formula
Like Rate (%) = (Total Likes / Total Impressions) × 100
2. Comments
Comments go beyond passive engagement and reflect genuine interest or emotional response. When users take the time to write something, they seek interaction, share opinions, or ask questions. This makes comments an essential metric for community engagement and sentiment insight.
High comment rates often indicate thought-provoking or controversial content. Brands should monitor and respond to comments to foster conversation and build relationships, while assessing the tone of interactions to understand public perception.
Formula
Comment Rate (%) = (Total Comments / Total Impressions) × 100
Wealthy Affiliate – Mini Review
If you’ve ever thought about turning your blog, passion, or niche into an online business,
Wealthy Affiliate (WA) is one of the most beginner-friendly platforms I’ve used.
It combines step-by-step training, website hosting, AI-powered tools,
keyword research, and an active community all in one place.
What I like most is that you can start free (no credit card needed), explore the platform,
test the tools, and connect with other entrepreneurs before upgrading.
WA isn’t a “get rich quick” scheme — success comes from consistent effort
and applying what you learn over time.
3. Shares
Shares indicate your content has high perceived value and is worth passing along to others. Without incurring additional expenses, this interaction exposes your content to new people and broadens your organic reach.
Users are more likely to share informative, emotional, or entertaining posts that align with their interests or identity. A high share rate indicates your content is resonating broadly and gaining traction. It also enhances your authority and credibility through peer validation.
Formula
Share Rate (%) = (Total Shares / Total Impressions) × 100
4. Saved Trends
A thorough analysis of social media reports can reveal how saves contribute to long-term content value and influence platform algorithms, even when they're not publicly visible.
This is common with educational, inspirational, or product-related content that audiences may want to revisit. Though not visible to others, the save signal is powerfully relevant and is used by some platforms to influence content ranking.
Tracking saved trends can help identify your audience's favourite topics or formats. High save rates suggest you’re producing relevant, evergreen content that continues to deliver value.
Formula
Save Rate (%) = (Total Saves / Total Impressions) × 100
5. Reach
The total number of unique users who have visited your content is your reach. It’s a critical metric for measuring content visibility and audience growth potential.
High reach indicates effective distribution or viral potential, while low reach may indicate poor timing, weak targeting, or low engagement.
Reach is especially useful in brand awareness campaigns and launch strategies where exposure matters. Unlike impressions, reach only counts each viewer once, making it a more precise measure of audience penetration.
Formula
Reach = Number Of Unique Users Who Viewed Content

6. Impressions
Impressions show the frequency of presentation of your material, including views from the same person. This metric gauges visibility and frequency but doesn’t guarantee user attention. High impressions may result from shares, reposts, or paid promotions.
Comparing impressions to engagement helps identify content quality—lots of impressions but low interaction may suggest content fatigue. It’s valuable for analyzing exposure over time, especially in campaigns with awareness goals.
Formula
Impressions = Total Number of Times Content Was Displayed (Including Repeats)
7. Follower Growth
Social media report analysis uses follower growth data to assess brand popularity, content effectiveness, and the overall success of marketing campaigns.
It provides insights into your brand’s popularity, content appeal, and campaign success. Positive growth reflects increased interest or visibility, while negative growth may indicate missteps or dissatisfaction.
This metric is handy when tied to events, promotions, or collaborations. It’s more meaningful when expressed as a percentage change rather than raw numbers, enabling better comparison across periods or platforms.
Formula
Follower Growth Rate (%) = [(New Followers – Unfollows) / Starting Followers] × 100
8. Click-Through Rate (CTR)
CTR measures how effectively your content prompts users to click a link. It’s essential for driving traffic to websites, landing pages, or e-commerce stores. A high CTR indicates that your call to action, visuals, or copy are compelling and relevant.
Low CTRS may signal weak targeting, unclear messaging, or poor design. Optimizing headlines, link placement, and audience segmentation can help improve this metric.
Formula
CTR (%) = (Total Link Clicks / Total Impressions) × 100
9. Conversion Rate
The percentage of people who complete a task after clicking a social network link is the conversion rate. This could be a purchase, a signup, a download, or a tracked action. It reflects the alignment between your content and the landing experience.
High conversion rates indicate strong intent and user satisfaction, while low rates may indicate friction or a disconnect. This is one of the most critical metrics for performance marketing and ROI tracking.
Formula
Conversion Rate (%) = (Conversions / Total Link Clicks) × 100
10. Engagement Rate
Engagement Rate is a comprehensive metric that aggregates all user interactions—likes, comments, shares, and sometimes saves—to assess overall content effectiveness.
It normalizes engagement by dividing it over total followers or impressions, allowing for fair post comparison. High engagement means your audience finds your content valuable and relevant. Low engagement may indicate a need to reassess the content strategy, post timing, or design.
Formula
Engagement Rate (%) = [(Likes + Comments + Shares + Saves) / Total Followers] × 100
11. Sentiment Analysis
Sentiment analysis evaluates the emotional tone of social media comments and mentions, classifying them as positive, negative, or neutral.
It’s vital for brand reputation management, allowing businesses to track public perception and respond proactively to negative feedback.
This metric adds qualitative depth to quantitative data, helping identify emerging issues or trends in user sentiment. Automated tools can streamline the analysis at scale.
Formula
Sentiment Score = (Positive Mentions – Negative Mentions) / Total Mentions

Tools For Social Media Report Analysis
Analyzing social media metrics is essential for growth. These top platform-specific and cross-platform tools help track performance, understand audiences, and optimize content strategies.
1. Facebook Insights / Meta Business Suite
Delivers in-depth metrics for Facebook and Instagram posts, stories, and audience engagement. Tracks reach, clicks, and demographics.
Enables businesses to optimize content strategy, scheduling, and targeting by analyzing audience behaviour and identifying performance trends.
2. Instagram Insights
Built into the app, this tool tracks post engagement, impressions, reach, and follower activity. It separates performance by content type, Reels, Stories, and posts, helping creators refine timing and improve interaction based on real audience data and content responses.
3. LinkedIn Analytics
Provides performance insights on post views, engagements, click-through rates, and audience details like job titles and industries.
It supports B2B marketers by highlighting high-performing updates and tracking follower trends, boosting content planning and professional brand visibility.
4. Twitter / X Analytics
Analyzes tweet impressions, engagements, and profile visits. Offers metrics on follower growth and content performance over time.
Helpful in refining post frequency, content style, and hashtags to increase engagement and expand audience reach on the platform.
5. TikTok Analytics
Tracks video views, likes, shares, audience geography, and follower growth. Divides data by content type and trending sounds.
Helps brands and creators monitor viral performance and tailor short-form video strategies to maximize engagement and platform impact.

6. YouTube Studio
Provides detailed metrics such as watch time, click-through rate, audience retention, and traffic sources. Analyzes subscriber behaviour and video performance. Ideal for creators who want to adjust content and publishing schedules based on viewer interest and engagement trends.
7. Sprout Social
Centralizes social data across platforms into one dashboard. Provides analytics, competitive benchmarking, engagement tracking, and scheduling.
Designed for teams and agencies needing detailed reports and data-driven insights to enhance content strategy and social media performance.
8. Hootsuite
Integrates posting, monitoring, and analytics across social channels. Tracks clicks, shares, engagement, and follower patterns.
Enables businesses to streamline social workflows, analyze content effectiveness, and coordinate strategies through a unified, easy-to-use platform.
9. Buffer
Simplifies social media scheduling while offering analytics on reach, clicks, and engagement. Presents visual reports to understand post-performance quickly. Ideal for individuals or small teams aiming to grow their online presence and refine content strategies efficiently.
10. Later
Features a drag-and-drop visual calendar, Instagram link tracking, and performance metrics. Designed for brands focusing on Instagram, it supports visual planning, content scheduling, and data analysis to improve reach and engagement through appealing, timely posts.

Conclusion
In today’s competitive digital landscape, social media report analysis is the foundation for making informed, strategic decisions that drive consistent growth and engagement.
Regularly reviewing and interpreting your social media metrics helps ensure you stay aligned with your goals and audience expectations. From boosting engagement to optimizing content, informed decisions start with precise analysis.
Keep evaluating, keep adapting—because in social media, the brands that measure smartly are the ones that grow consistently.
I trust you enjoyed this article on the Social Media Report Analysis That Drives Real Results. Please stay tuned for more insightful blogs on affiliate marketing, online business, and working from anywhere in the world.
Take care!
— JeannetteZ 🌍✨
💬 Your Opinion Is Important To Me
Do you have thoughts, ideas, or questions? I’d love to hear from you. Please leave your comments below or email me directly at Jeannette@WorkFromAnywhereInTheWorld.com.
📚 More Work From Anywhere Reads
🚀 Ready to Build a Business You Can Run from Home
Or from Anywhere in the World?
Imagine creating income on your terms — from home, a cozy café, or wherever life takes you.
With the right tools, training, and community support, it’s entirely possible.
Start your own online business for free — no credit card needed.
Disclosure
This post may contain affiliate links. As an Amazon Associate and participant in other affiliate programs, I earn from qualifying purchases at no extra cost to you. Please read my full affiliate disclosure.